Makro Sales Data Analysis Guide: How to Identify Best-Selling Products and Growth Opportunities?
Why do Makro stores have sales volume but not necessarily profit?
For Makro sellers, an increase in orders is usually good news, but sales growth does not necessarily mean the business is improving.
When analyzing e-commerce operations issues, I pay special attention to several easily overlooked phenomena: some products sell well but have limited profits due to procurement, fulfillment, and return costs; Some products suddenly sell well in the short term, but demand quickly drops after the seller restocks; and some products tie up inventory funds for a long time without bringing ideal returns.
The common point of these problems is: sellers see the sales results but do not fully understand the reasons behind the results.
Makro's SellerPortal provides reports related to orders, sales, fulfillment, and returns, which can help sellers understand their store operations.、
However, when the number of products increases, or when the business covers multiple e-commerce platforms at the same time, relying solely on manual report organization and scattered spreadsheets may make it difficult to continuously identify trends.
Therefore, I believe that Makro sales data analysis should not only answer "how much was sold this month" but should also answer three more valuable questions: Which products are worth continuing to invest in? Which products need adjustment? Where are the next growth opportunities?
This article will introduce a set of analysis methods more suitable for daily operations from four aspects: core metrics, identification of best-selling products, inventory and profit optimization, and the application of Revenuealot data analysis tools.
I. Which core metrics should Makro sales data analysis focus on?
If you only look at sales revenue, it is easy to make one-sided judgments about product performance. I suggest first establishing a basic metric system, then gradually adding analysis dimensions according to the business stage.
1. Sales revenue, order volume, and sales volume trends
Sales revenue can reflect business scale, while order volume and sales volume help understand actual demand. Looking at the three together is more meaningful than observing sales revenue alone.
For example, if a product's sales revenue increased by 20% this month but sales volume basically did not change, this may mean the selling price increased, or the product mix changed. Conversely, if sales volume grew significantly but sales revenue did not grow in sync, it is worth further checking whether there is a price reduction promotion or an increase in the proportion of low-priced products.
I usually recommend comparing data for at least the most recent 7 days, 30 days, and 90 days. Short cycles are suitable for identifying recent fluctuations, medium cycles help evaluate operational adjustments, and longer cycles help identify seasonal trends. The specific cycle also needs to be combined with product sales frequency.
2. Product performance, returns, and actual profit
When analyzing an individual product, I focus on sales volume, sales revenue, return situations, and costs, rather than only looking at rankings.
It should be noted that gross profit is not equal to final net profit. In addition to product procurement costs, platform commissions, fulfillment fees, promotion expenses, return losses, and other items should also be considered when evaluating actual returns. The cost structure of different products may differ, so it is not appropriate to evaluate all products using a single gross margin standard.
Truly valuable Makro sales analysis is to observe multiple metrics together and find the relationship between growth, profitability, and operational efficiency.
II. How to identify best-selling products through Makro sales data?
Identifying best-selling products is not just about finding the products with the highest sales volume, but about judging which products have sustained demand and which growth signals are worth further verification.
1. Distinguish between consistently best-selling products, potential products, and short-term explosive products
I roughly divide products into three categories.
The first category is consistently best-selling products. These products have stable sales volume across multiple statistical periods, and demand is relatively predictable, making them suitable for focusing on inventory assurance and profit performance.
The second category is potential products. Their current sales scale may not be large, but recent sales volume has continued to improve, or performance has improved after optimization of price, product details, and inventory conditions. Such products are worth further observation, rather than significantly increasing procurement based solely on short-term growth.
The third category is short-term explosive products. They may be affected by promotions, seasonal demand, or a certain traffic change. Sellers need to confirm whether the growth is sustainable and avoid mistaking a one-time peak for long-term demand.
2. Find growth signals through sales trends and product performance
When analyzing Makro's best-selling products, I suggest adopting the following approach:
- Observe continuous changes: compare sales volume and sales revenue across different periods to determine whether growth is continuous or only occurs on individual dates.
- Check price impact: record the selling price and sales volume before and after promotions to determine whether growth depends on deep discounts.
- Combine returns and profit: products with high sales volume but many returns and low profit are not necessarily worth prioritizing for expansion.
- Look for product mix opportunities: if there are obvious differences in performance among similar products, further check factors such as price, product information, reviews, and inventory.
It should be emphasized that a seller's own store sales reports usually cannot directly prove the total sales volume of a certain product on the entire Makro platform.
If researching competing products, legally obtainable market information, price changes, and competitor research data should be combined, and estimates should be clearly distinguished from actual sales data.
This is also why I believe data analysis is more important than simply chasing popular rankings: rankings tell us who is currently performing well, while trend analysis helps us determine what actions we should take.
III. How to use Makro sales analysis to optimize inventory and profit?
Discovering best-selling products is only the first step. For sellers, what is more important is to translate sales trends into restocking, pricing, and inventory management decisions. If judgments are wrong, even if sales grow, there may be stockouts, overstocking, or cash flow pressure.
1. Formulate restocking plans based on sales speed
I suggest combining the product's recent average daily sales volume with current sellable inventory to estimate how long the inventory can last.
A simple calculation method is:
Inventory coverage days ≡ current sellable inventory / average daily sales volume
For example, if a product currently has 120 units of sellable inventory and sold an average of 4 units per day over the past 30 days, then the theoretical inventory coverage days is 30 days.
But this does not mean the seller can necessarily wait until the 30th day to restock. Actual operations also need to consider procurement cycles, inbound time, sales fluctuations, and safety stock.
If a product's recent sales volume continues to grow, the restocking plan should be reassessed promptly; If sales volume is declining, inventory should be increased cautiously.
2. Identify slow-moving products and profit improvement opportunities
Inventory management should not only focus on best-selling products. I also regularly check products with long-term low sales volume, accumulated inventory, or abnormal return performance.
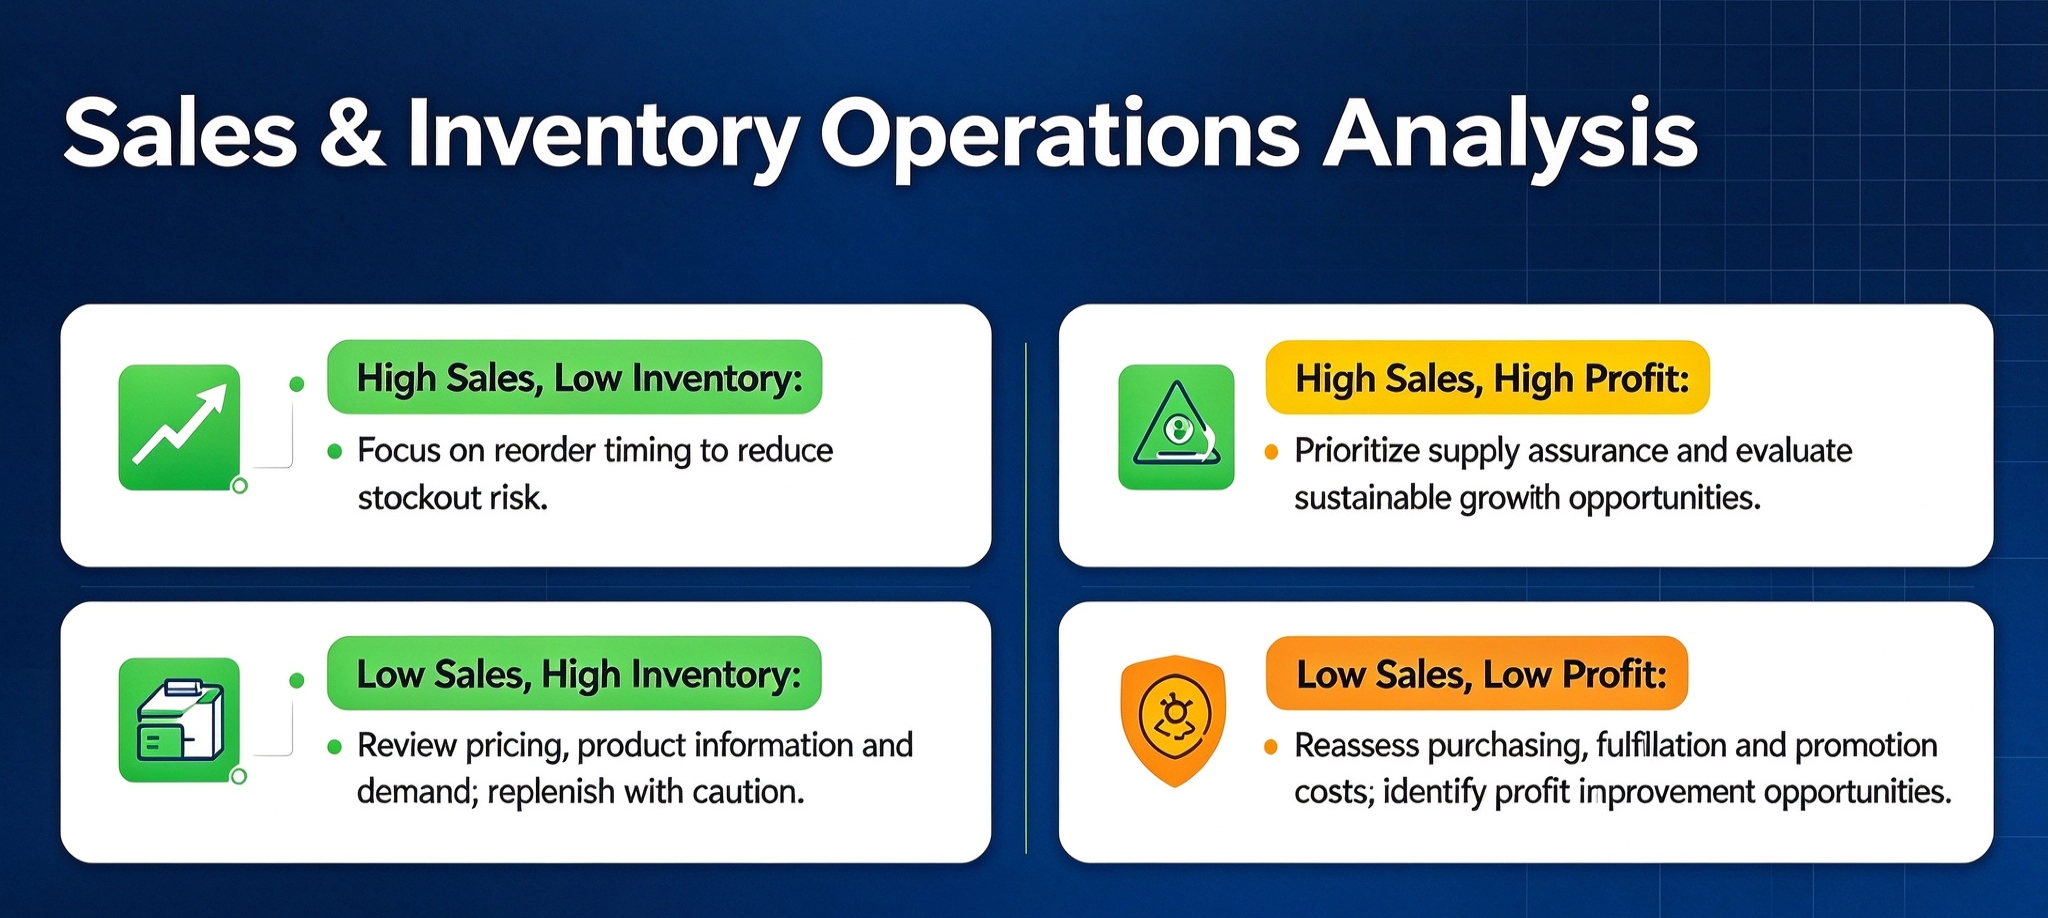
For slow-moving products, I would not directly recommend uniformly reducing prices for clearance. A more reasonable approach is to first determine the cause: whether product demand has weakened, whether the price lacks competitiveness, whether product details are not clear enough, or whether inventory was overplanned at the procurement stage. After finding the cause, then decide whether to adjust prices, optimize product pages, control procurement, or exit the product.
For best-selling products with low profit, the full cost should be recalculated, whether promotional discounts are reasonable should be evaluated, and whether there is room for procurement cost optimization should be assessed.
IV. How to use Revenuealot to improve the efficiency of Makro data-driven decision-making?
When a store has only a small number of products, manually checking reports may be sufficient. But as the number of SKUs increases and the analysis period lengthens, manually organizing data will consume more and more time and make it easier to miss trend changes.
I prefer to establish a fixed data review process and use suitable e-commerce data analysis tools to improve efficiency.
1. Use Revenuealot to analyze product performance and sales trends
Revenuealot is a multi-platform management and data analysis SaaS tool for South African e-commerce businesses, supporting e-commerce platforms such as Makro. Makro-related tools include StoreMetrics and ProductAnalytics, helping sellers understand business performance from both the store and product levels.
For Makro sellers, the value of such tools lies not only in centralized data viewing, but also in helping daily operations form clearer judgment logic.
For example, when a product's sales performance changes, product analytics and historical trends can be combined for review; When operating multiple stores or sales channels, repetitive work caused by decentralized management can also be reduced based on the platforms actually connected and authorized accounts. Specific available metrics and data scope should be subject to the current product page and the actual connection status of the account.
Revenuealot's positioning is not to guarantee that a certain product will definitely sell well for sellers, but to help sellers use business data more effectively. Product selection, procurement, and pricing still need to be judged based on costs, supply chain capabilities, and actual market conditions.
2. Establish a weekly review mechanism so that data truly guides action
I suggest that Makro sellers conduct a brief business review at a fixed time every week and record three results: what problem was discovered, what action is planned, and what metric will be used next week to verify the effect.
Review stage | Key checks | Next action |
|---|---|---|
Sales performance | Sales volume, sales revenue, and period changes | Identify products with growth or decline |
Product performance | Price, returns, profit situation | Adjust product strategy |
Inventory management | Inventory coverage days, restocking cycle | Formulate restocking or inventory control plans |
Business verification | Changes in metrics before and after adjustment | Determine whether measures are effective |
This process does not need to pursue complex data models from the beginning. First ensure consistent metric definitions, clear data sources, and that each analysis can correspond to actual actions. This is already more valuable than only checking total sales at the end of the month.
If you are operating a Makro store and hope to discover more growth opportunities from sales reports, you can visit the Revenuealot official website to learn about its Makro store metrics, product analytics, and related e-commerce operation tools, and then choose a suitable solution according to your product scale and management needs.
Makro Sales Data Analysis FAQ
1. Which sales data should Makro sellers focus on?
It is recommended to prioritize sales revenue, sales volume, order volume, return situations, product profit, and inventory turnover. Observing these metrics across multiple periods is more helpful for identifying business problems than simply checking sales rankings.
2. How to determine whether a best-selling product on Makro is worth purchasing?
You can only look at sales volume in a certain period. You also need to verify whether demand is sustainable, whether the competitive price is reasonable, whether procurement and fulfillment costs are controllable, and whether the product has sufficient profit margin. For short-term explosive products, avoid large-scale stocking based solely on a single sales peak.
3. Can Makro SellerPortal provide sales analysis data?
The Reports area of Makro SellerPortal provides reports such as daily net sales, fulfillment, and return fulfillment, which can be used to understand sales and operations. Sellers should understand the data according to report definitions and statistical dates, and avoid directly comparing figures with different definitions.
4. What can Revenuealot help Makro sellers do?
Revenuealot provides Makro-related store metrics and product analytics tools, and provides multi-platform operation management capabilities for South African e-commerce sellers. Sellers can use relevant data to analyze product performance and sales trends according to actual connection conditions. Specific functions are subject to the current instructions on the official website.
5. How often is it appropriate to analyze Makro sales data?
Generally, business performance can be reviewed weekly, and longer-term sales trends and profit conditions can be evaluated monthly. For products with large sales fluctuations, tight inventory, or frequent promotions, the inspection frequency can be appropriately increased. The key is not that the more analyses the better, but that data updates remain consistent with the pace of decisions such as restocking and pricing.
Conclusion: Let Makro sales data become the basis for growth
For Makro sellers, the ultimate purpose of sales data analysis is not to produce more reports, but to reduce decisions made based on experience alone.
When you can identify consistently best-selling products, distinguish short-term fluctuations, understand the relationship between profit and inventory, and regularly verify the results of operational adjustments, sales data truly becomes the basis for business growth.
I suggest starting with the three most basic actions: checking product sales trends every week, regularly reviewing inventory and profit, and recording the results of each operational adjustment. As products and channels increase, they use data analysis tools such as Revenuealot to improve business analysis efficiency, making every restocking, pricing, and product optimization more evidence-based.