Ads Analytics
Ads Analytics is designed to maximize your Return on Ad Spend (ROAS). It not only aggregates data from all ad campaigns but also provides period-over-period growth analysis and visualized trend charts, ensuring every cent of your budget is spent wisely.
Core Metrics Dashboard
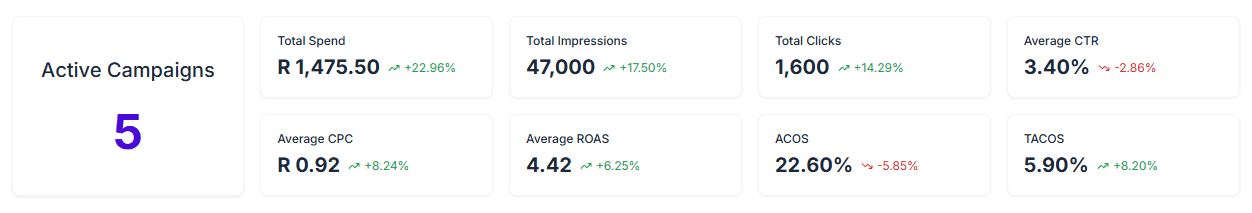
The top of the dashboard displays Key Performance Indicators (KPIs) and compares them with the previous period (showing growth rates):
- Total Spend: Your ad investment within the selected period.
- Total Revenue: Direct sales revenue generated by ads.
- ROAS (Return on Ad Spend): The core metric for measuring ad efficiency (Revenue / Spend).
- ACOS (Advertising Cost of Sales): Spend as a percentage of Revenue. Lower is better.
- TACOS (Total Advertising Cost of Sales): Ad Spend divided by Total Store Revenue. Measures the overall impact of ads on your business health.
- Impressions & Clicks: Exposure and engagement metrics reflecting ad reach.
Feature Details
1. Visual Trend Charts
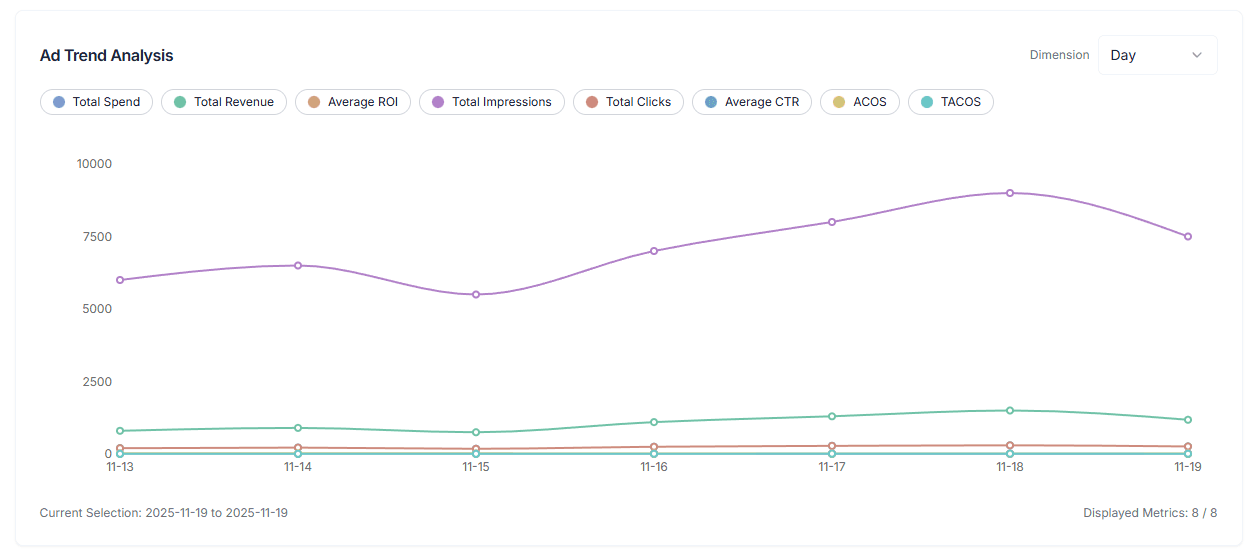
Move beyond boring tables and discover trends intuitively through charts:
- Dual-Axis Comparison: View the relationship between two metrics simultaneously (e.g., “Spend vs Revenue” or “CPC vs CTR”).
- Time Granularity: Support data aggregation by Day, Week, or Month.
- Anomaly Detection: Quickly spot sudden drops in traffic or spikes in spending on specific days.
2. Campaign List
A detailed campaign management list supporting high customization:
- Status Management: View campaign status (Active, Paused, Archived, etc.).
- Budget Control: Monitor the usage of daily or total budgets.
- Custom Columns: You can freely choose to display 20+ metrics such as Impressions, CPC, CTR, ROI, etc.
- Smart Sorting: Support sorting by any metric, for example, sorting by ROAS in descending order to find top-performing campaigns.
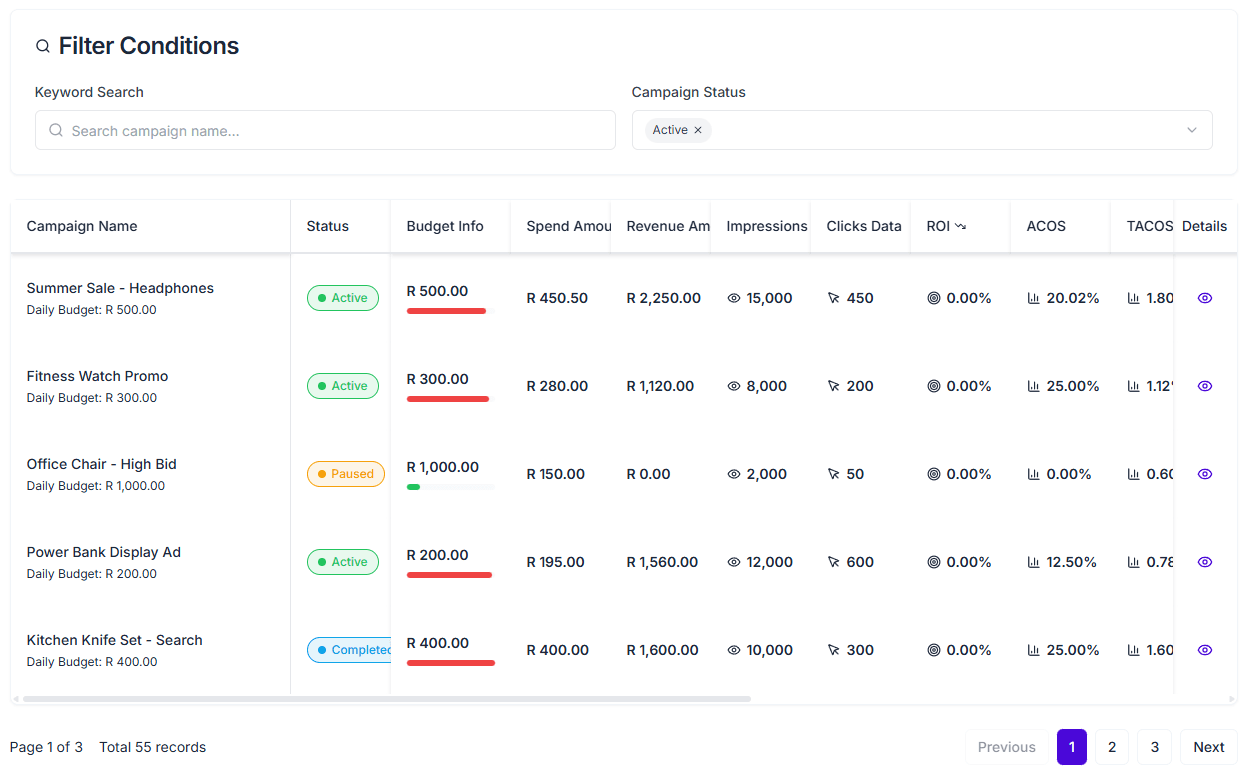
3. Precise Filtering & Export
- Multi-Dimensional Filtering: Filter by Status, Objective, Budget Range, and ROI Range combinations.
- Data Export: Support exporting currently filtered ad data to Excel/CSV for offline deep analysis or reporting.
Optimization Strategies
Focus on TACOS If your ACOS is low but TACOS is high, it may mean you are overly reliant on ad sales and lack organic traffic. Ideal TACOS should remain within a healthy profit margin.
Comparison Analysis The system automatically calculates data changes compared to the Previous Period (Period-over-Period). If ROAS shows a red downward arrow, it is recommended to immediately check recent bidding strategy adjustments or market competition.