Product Analytics
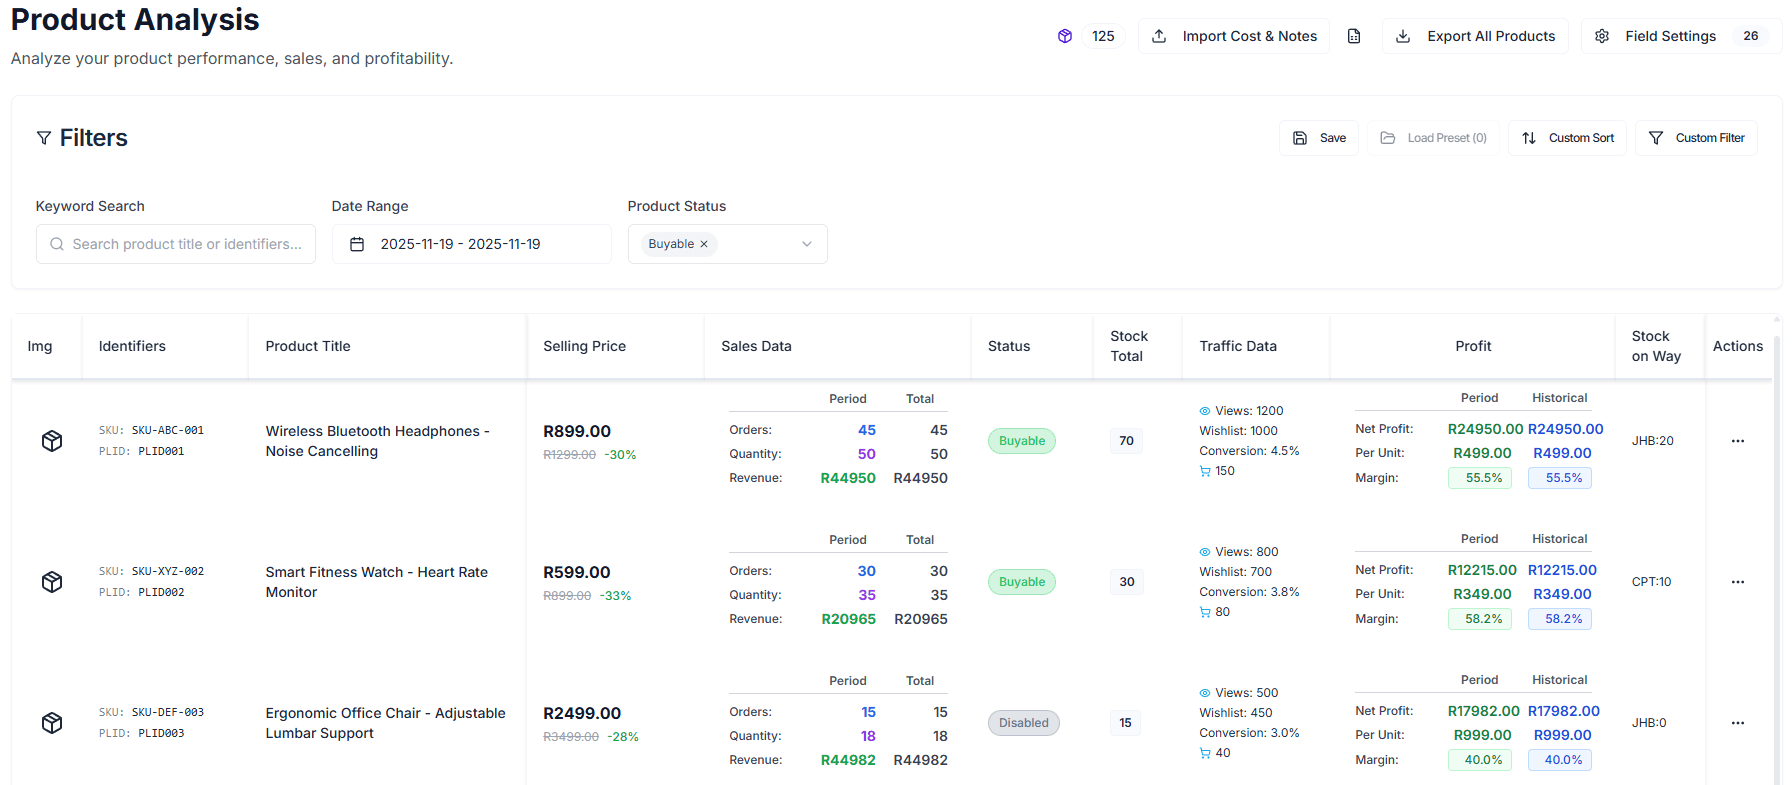
Product Analytics is the core data hub for your store operations. It is not just a product list, but a powerful analysis tool that allows you to deeply analyze the performance of every SKU from multiple dimensions such as sales, traffic, inventory, and finance.
Through highly customizable views and powerful filtering capabilities, you can quickly identify best-sellers, slow-moving items, and potential winners.
Core Feature Modules
1. Multi-Dimensional Data Metrics
The system provides a rich set of data columns for you to choose from. You can enable or disable them by clicking “Column Settings” in the top right corner:
- Basic Information: Image, Title, TSIN, SKU, PLID, etc.
- Sales Performance:
- Units & Orders: View sales volume (Units) and order count (Orders) within a specific time range.
- Revenue: Accurately track product sales revenue.
- Return Data: Return Rate and Return Count, helping you monitor product quality issues.
- Traffic Analysis (Requires connected data):
- Views & Visits: Measure product exposure.
- Add to Cart & Conversion Rate: Evaluate traffic monetization capability.
- Inventory Monitoring:
- Inventory Overview: Total Stock, Stock on Way, Warehouse Stock.
- Inventory Turnover: Stock 30 Days Cover, warning of stockout risks.
- Financial Analysis:
- Cost & Profit: After entering the Product Cost, the system automatically calculates Gross Profit and Margin.
2. Smart Filtering & Sorting
Use the sidebar filters to quickly locate target products:
- Date Range: Customize the time window for analysis (default is the last 30 days).
- Status Filtering: Filter by Takealot status (e.g., Buyable, Not Buyable).
- Tag Filtering: Quickly find products that have Video (Has Video), have Ads (Has Ad), or have a Brand (Has Brand).
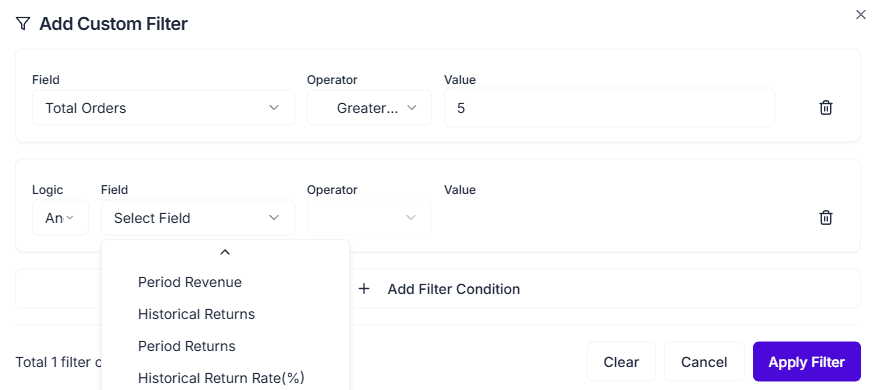
- Advanced Filtering: Support combined conditions, such as “Units > 100 AND Conversion Rate < 1%”.
3. Quick Actions & Management
Manage your product assets directly from the list:
- Cost Entry: Click the “Cost” column to directly input cost prices and immediately view profit analysis.
- Notes Management: Click “Notes” to add operational notes for team collaboration.
- Jump to Details: Click on a product to enter its detail page and view more granular historical trend charts.
Use Case Examples
Scenario 1: Clearing Stagnant Inventory
- Filter for products with “Stock Cover Days > 90”.
- Sort by “Units” from Low to High.
- Identify products with overstock and slow sales to consider price reductions or promotions.
Scenario 2: Optimizing Low-Conversion Products
- Filter for products with “Visits > 1000” AND “Conversion Rate < 1%”.
- Check the detail pages of these products (images, description, price) to find room for optimization.
Note: Traffic Data and Inventory Data are optional loading items. The system intelligently loads them based on your needs to ensure page smoothness.