
Takealot Ads Analytics Guide: Find Ad Waste Before It Hurts Profit
Takealot Ads Analytics becomes most valuable when ad spend rises faster than your confidence in where profit is really coming from.
That is the point where many sellers get stuck. Orders still come in, campaigns are still active, and the account does not look obviously broken. But profit feels softer, budget feels less efficient, and every change starts to feel reactive.
That is where Revenuealot Ads Analytics is useful. It helps you read spend, revenue, ROAS, ACOS, TACOS, clicks, and campaign performance together so you can tell whether the problem is broad account efficiency, a handful of weak campaigns, or over-reliance on paid traffic.
If you want the feature walkthrough alongside this article, start with the Ads Analytics docs. If you want to see the product overview first, go to Ads Analytics.
Quick answer: how do you know your Takealot ads are wasting budget?
The clearest warning signs are usually not dramatic. They show up in patterns like these:
- spend rises faster than revenue
- ROAS looks weaker period over period
- ACOS looks tolerable, but TACOS keeps drifting upward
- clicks increase, but sales contribution barely changes
- certain campaigns stay live for weeks without creating meaningful return
That is why an ad spend audit matters. You are not just looking for the campaigns that spend the most. You are looking for the places where spend and business contribution have fallen out of proportion.
Why ad waste rarely looks like one obvious mistake
Most ad accounts do not break all at once.
Waste usually builds up quietly:
- bids rise on terms that are no longer efficient
- old campaigns keep running because no one can prove they should stop
- budget gets spread across average performers instead of concentrated into stronger ones
- paid sales keep growing, but overall store health does not improve much
That is why top-level ad metrics matter so much. They tell you whether the account is drifting before you start chasing single-campaign explanations.
Start with the relationship between ROAS, ACOS, and TACOS
Many sellers look at only one efficiency metric and stop there. That is usually not enough.
The more useful question is how these three metrics behave together:
| Metric | What it tells you | What it can miss if read alone |
|---|---|---|
| ROAS | How much revenue ads generate relative to spend | It does not show whether ads are becoming too important to the business |
| ACOS | How much of ad-driven revenue is being consumed by ad cost | It can look healthy even if overall ad dependence is rising |
| TACOS | How much ad spend takes from total store revenue | It helps show whether paid sales are supporting growth or replacing healthy organic sales |
This is one of the most practical reasons to use Ads Analytics.
If ROAS weakens, that is a clear efficiency warning. If ACOS looks fine but TACOS keeps rising, that is a different warning: the account may still be producing orders, but paid traffic is taking too much responsibility for keeping the store moving.
A simple decision table for your first ad spend review
| What you see | Likely reading | Best next move |
|---|---|---|
| Spend up, revenue flat | Efficiency is slipping | Review budget allocation and weak campaigns first |
| Clicks up, ROAS down | Traffic quality or listing conversion is weakening | Check keyword quality and listing strength |
| ACOS stable, TACOS rising | Ads are carrying too much of total sales | Review organic positioning and campaign dependence |
| Revenue grows, profit does not | Ad contribution may be too expensive | Recheck CPC, bid pressure, and budget concentration |
| Long-running active campaigns with weak return | Budget is tied up in low-contribution activity | Reduce, pause, or restructure those campaigns |
Period-over-period comparisons help you catch decline earlier
One of the most useful parts of Ads Analytics is that it compares key metrics with the previous period.
That matters because weak performance is easier to spot when you stop asking “is this number good?” and start asking “is this number getting better or worse?”
If the previous-period comparison shows:
- ROAS trending down
- spend trending up
- clicks growing without matching revenue growth
then you are probably looking at a pattern, not a one-day wobble.
That makes it easier to act before wasted spend turns into a longer profit problem.
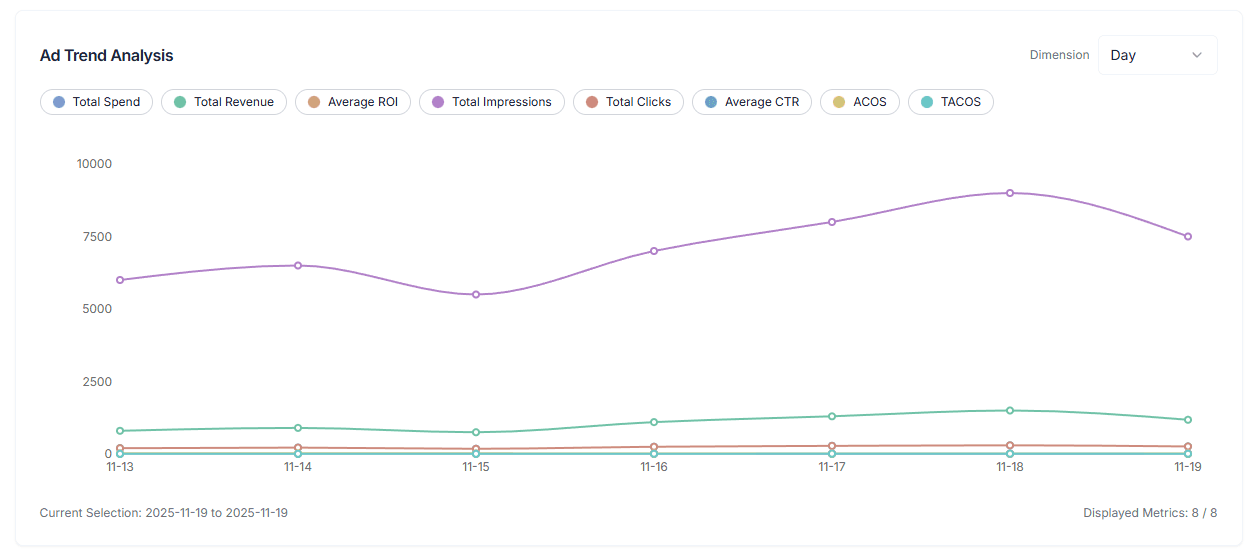
Trend charts tell you whether the problem is structural or temporary
Charts matter because they show whether a weak metric is noise or direction.
The comparisons that usually reveal the most are:
- Spend vs Revenue
- CPC vs CTR
- Clicks vs Revenue
If you see spend climbing steadily while revenue barely moves, that is usually a structural efficiency issue. If CPC rises without CTR improving, the account may be paying more without getting meaningfully stronger response.
The trend view is especially useful when you review data by day, week, or month. It helps you avoid overreacting to one bad day while still catching longer deterioration.
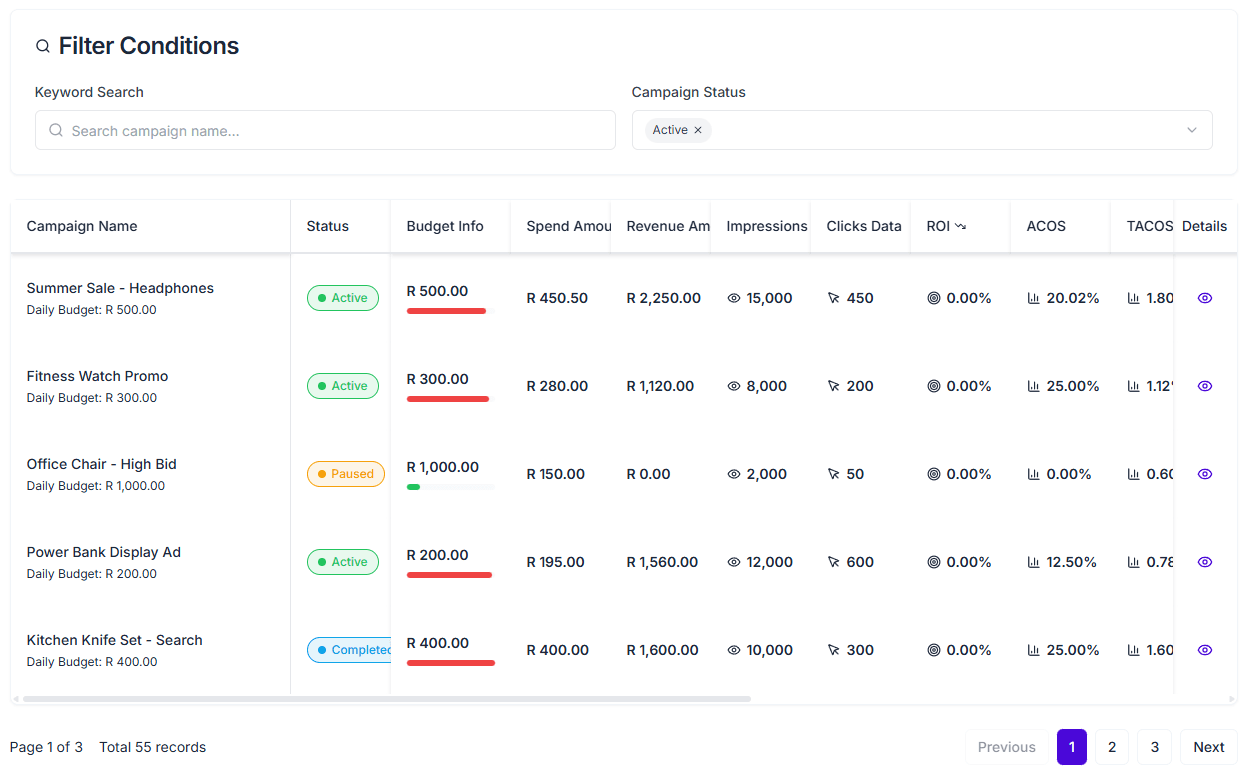
The campaign list is where ad waste becomes actionable
Top-line metrics tell you what is going wrong. The campaign list tells you where to act.
Ads Analytics gives you a more usable review workflow because you can work from:
- campaign status
- objective
- budget range
- ROI range
- custom metric columns
- exports for offline review
That makes it much easier to narrow the account to the campaigns that deserve immediate attention.
The first three campaign groups I would review are:
- high spend, weak return
- active campaigns that consume budget quickly but stay average
- older campaigns with long-running mediocre performance
A practical 15-minute Takealot ad spend audit
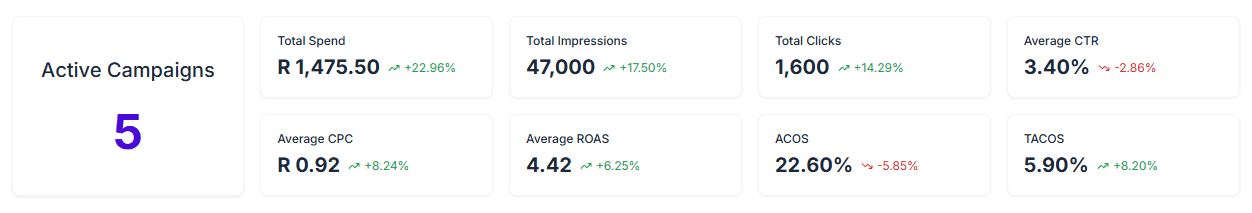
1. Check total Spend, Revenue, ROAS, ACOS, and TACOS
This tells you whether the issue is local or account-wide.
2. Compare the period against the previous one
You want to know whether efficiency is improving, flattening, or deteriorating.
3. Open the trend charts
Check whether the weakness is concentrated on a few days or visible across the wider period.
4. Filter the campaign list
Start with active campaigns, then narrow by ROI range, objective, or budget range until the weak performers are easier to isolate.
5. Export the filtered set if you review with a team
Exports are useful when you need to compare weekly changes, share findings, or keep a repeatable review rhythm.
When Ads Analytics becomes especially valuable
This kind of review becomes much more important when:
- ad spend is no longer small enough to ignore
- you manage enough campaigns that manual scanning is too slow
- the store still gets ad sales, but profit quality feels weaker
- the question is no longer “should we advertise?” but “which campaigns still deserve budget?”
That is the point where better visibility often matters more than more spending.
FAQ
What is the difference between ACOS and TACOS on Takealot?
ACOS compares ad spend to ad-generated revenue. TACOS compares ad spend to total store revenue. ACOS helps you judge campaign efficiency, while TACOS helps you judge how dependent the store is becoming on paid sales.
What should I check first when my ad budget keeps growing?
Start with total Spend, Revenue, ROAS, ACOS, and TACOS. Then move into period-over-period changes and trend charts. Only after that should you drill into individual campaigns.
What should I look at after I find weak campaigns?
The next step is often keyword quality. If traffic is arriving but sales quality is weak, pair this review with Keyword Research to decide which search terms deserve budget and which ones do not.
Final takeaway
Reducing ad waste on Takealot is not mainly about cutting spend. It is about knowing which spend is still contributing, which spend is compensating for weak structure, and which spend has simply become too expensive to justify.
Revenuealot Ads Analytics helps you answer that with more discipline. Instead of reacting only when the budget feels too high, you can use top metrics, period comparisons, trend charts, campaign filters, and exports to see where performance is actually weakening.
If you want to audit your account now, open Ads Analytics and work through the weak spots in order. Keep the Ads Analytics docs open if you want the feature details next to your review.