
Takealot Store Metrics Guide: What to Check First When Sales Slow Down
When Takealot sales slow down, the hardest part is usually not noticing the weakness. It is choosing the first metric that explains it.
Sales can soften for very different reasons:
- traffic is down
- conversion is slipping
- profit quality is weakening
- refunds are quietly eating margin
- promotions create movement, but not healthy growth
That is why Revenuealot Store Metrics is useful. It helps you review revenue, orders, visitors, conversion, profit, refunds, and promotion performance in one place so you can tell whether the store is genuinely slowing down or just moving through short-term noise.
If you want the feature walkthrough next to this article, start with the Store Metrics docs. If you want to see the product overview first, go to Store Metrics.
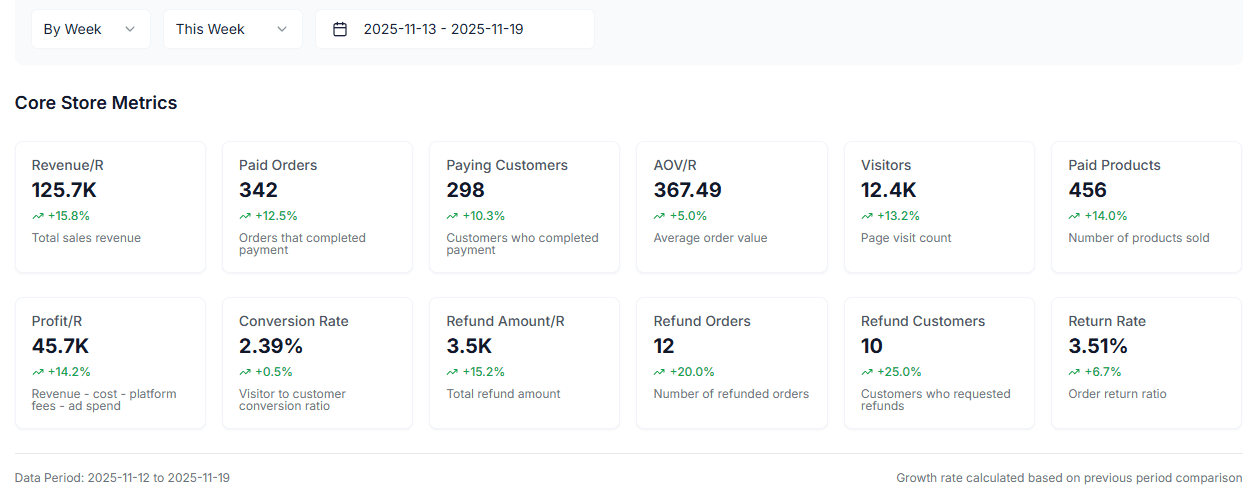
Quick answer: which Takealot store metrics matter most first?
If sales feel weaker and you need a fast starting point, begin with these six metrics:
- Revenue
- Paid Orders
- Visitors
- Conversion Rate
- Profit
- Refund Amount / Refund Rate
These are usually enough to tell you whether the issue is about traffic, conversion, margin quality, or after-sales friction.
If you only have 10 minutes, do not try to interpret everything. Start by answering three questions: is traffic down, is conversion weakening, and is profit being eroded by refunds or promotions?
Why most store reviews become noisy
The problem is rarely a lack of data.
The problem is that once you have many metrics, it becomes easy to review everything without learning much from it. Sellers often look at too many numbers with no clear order, which makes it harder to see what is actually changing.
The better approach is to treat store metrics like a diagnostic sequence, not a data dump.
Start with a small metric set that explains most store movement
| Metric | What it helps you answer | If it weakens, check this next |
|---|---|---|
| Revenue + Paid Orders | Is the store broadly growing or under pressure? | traffic quality, pricing, promotions |
| Visitors | Is less traffic reaching the store? | ads, ranking, discoverability |
| Conversion Rate | Are visitors less willing to buy? | listing quality, value proposition, price, reviews |
| Profit | Is growth still healthy after costs? | ad spend, fees, refunds, discounting |
| Refund Amount / Refund Rate | Are post-purchase issues eating margin? | product quality, expectation-setting, fulfillment |
This is why a simpler review order is more powerful. These metrics do not answer everything, but together they usually tell you where to investigate next.
First question: is this a traffic problem or a conversion problem?
This is often the fastest and most useful split.
Read these three metrics together:
- Visitors
- Paid Orders
- Conversion Rate
If visitors fall sharply, the issue is more likely to sit in visibility, ads, ranking, or promotion exposure.
If visitors stay steady while orders and conversion rate weaken, the issue is more likely to sit in the offer itself:
- price competitiveness
- listing clarity
- images or value communication
- review strength
- stronger competing offers
That simple distinction saves a lot of wasted guessing.
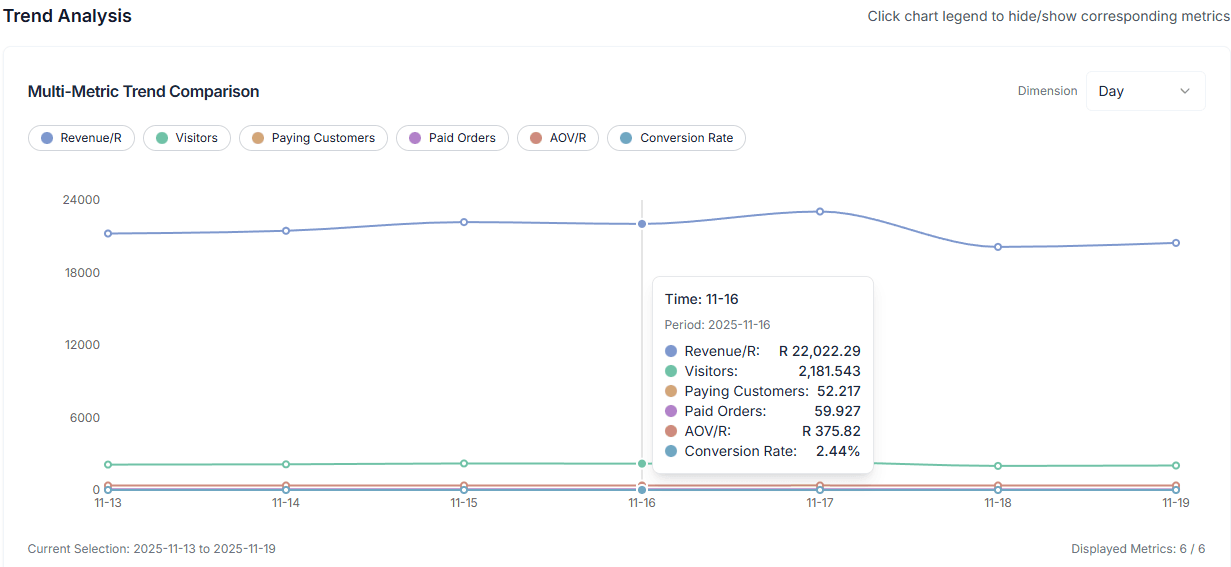
Before you explain one bad day, check whether the trend has been weakening for a while
Many stores do not really decline overnight. The signal usually builds across several days or weeks before it becomes obvious.
That is why the trend view matters so much. Store Metrics supports a multi-metric trend chart, which makes it much easier to compare how the store has been moving over time instead of reacting to one isolated drop.
The most useful metrics to compare together are usually:
- Revenue
- Visitors
- Paid Orders
- Conversion Rate
- Profit
That tells you:
- whether traffic weakened first or conversion weakened first
- whether sales are still growing while profit quality slips
- whether you are seeing temporary noise or a repeated pattern
Revenue should never be read without profit
Revenue is an important signal, but it can also mislead.
It is possible for revenue to rise while the business becomes less healthy because:
- ad spend is taking a larger share
- fees are growing faster than expected
- discounting becomes more aggressive
- refund volume rises
That is why Revenue and Profit belong together in any serious review.
If revenue improves but profit stays flat or weakens, that is not the same thing as healthy growth. It usually means the store is working harder for the same or lower quality outcome.
Conversion Rate is one of the best early warning signals
Sellers often focus heavily on traffic, but Conversion Rate is one of the clearest indicators of whether the store is still compelling once a shopper arrives.
When conversion starts slipping, the likely causes are often:
- weaker price positioning
- less persuasive listing content
- weaker image quality or value communication
- review changes
- competitor offers becoming more attractive
In other words, conversion often tells you sooner than revenue that the offer itself is losing strength.
A decision table that turns metrics into next actions
| What you notice | Most likely issue | Best next move |
|---|---|---|
| Visitors down while conversion is steady | traffic acquisition is weakening | review ads, rankings, and promotional visibility |
| Visitors steady but conversion falls | the offer is weaker than before | review price, listing content, images, and reviews |
| Revenue up but profit flat | growth quality is deteriorating | check fees, ad cost, refunds, and discounting |
| Refund amount keeps rising | after-sales experience is deteriorating | inspect return reasons, quality issues, and fulfillment |
| Promotions drive short spikes but results fade quickly | baseline demand is still weak | strengthen listing conversion and recurring traffic |
Refund and refund-rate metrics often reveal the hidden margin leak
Some stores look active on the surface and still feel less healthy than they should. The missing explanation often sits in refund behavior.
The most useful refund-related metrics are:
- Refund Amount
- Refund Orders
- Refund Customers
- Refund Rate
If these begin to climb, the store may be dealing with something deeper than normal noise:
- product quality inconsistency
- inaccurate expectation-setting
- packaging or fulfillment issues
- a listing that is attracting the wrong buyer intent
These are expensive problems because they hurt both margin and long-term trust.
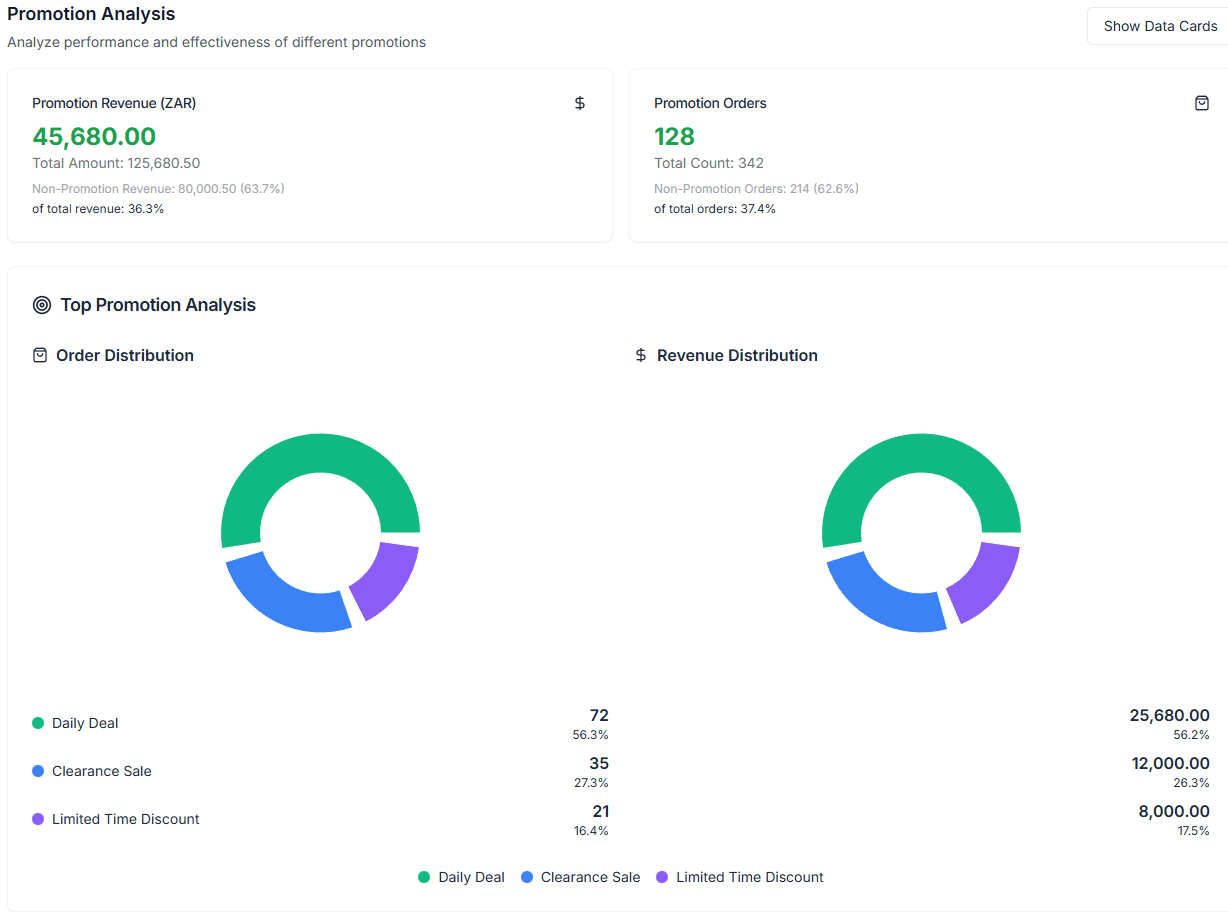
Promotion analysis helps answer a better question than “did the campaign sell?”
A lot of store reviews stop at one basic question after a promotion: did it create orders?
The more useful question is whether it improved the business in a healthy way.
Store Metrics includes promotion analysis so you can compare:
- promotion revenue versus total revenue
- promotion orders versus total orders
- performance across individual promotions
That is valuable because some promotions create movement without improving the store’s underlying quality. If orders rise briefly but margin quality weakens or performance fades quickly afterward, the promotion may not be worth repeating in the same form.
A practical weekly review rhythm that is easier to keep
Many sellers benefit more from a repeatable rhythm than from a very deep review done occasionally.
A simple pattern that works well is:
- check Revenue, Paid Orders, Visitors, and Conversion Rate daily
- review Profit, Refunds, and trend charts weekly
- run a separate promotion review after every meaningful campaign
- export day, week, or month views when you need to compare periods more carefully
That is when the dashboard becomes more than a reporting surface. It becomes an operating habit.
FAQ
Which store metrics should I check first when sales drop on Takealot?
Start with Revenue, Paid Orders, Visitors, Conversion Rate, Profit, and Refund Amount or Refund Rate. That set is usually enough to tell you whether the problem is traffic, conversion, margin, or post-purchase quality.
How do I tell whether the problem is traffic or conversion?
Compare Visitors, Paid Orders, and Conversion Rate together. If visitors fall, it is usually a traffic problem. If visitors stay steady but conversion weakens, the problem is more likely inside the offer, listing, pricing, or trust signals.
What should I review after Store Metrics shows weakness?
That depends on where the weakness sits. If traffic looks softer, pair the review with Ads Analytics. If demand capture looks stable but conversion or product fit feels weaker, Competitor Research is often the next useful step.
Final takeaway
The real value of Takealot store analytics is not seeing more numbers. It is reading the right numbers in the right order.
Revenuealot Store Metrics helps you do that by combining core KPIs, trend analysis, promotion analysis, and exportable views in one workflow. That makes it much easier to tell whether the store is truly growing, quietly weakening, or simply moving through normal short-term variation.
If you want a faster performance review process now, open Store Metrics and work through the core numbers in order. Keep the Store Metrics docs nearby if you want a more detailed walkthrough while you review.