Takealot Product Analytics Guide: Review Winning SKUs, Margin Leaks, and Slow Movers
Takealot Product Analytics is most useful when you need to decide which SKUs deserve action this week, not just which products exist in the catalog.
One of the most common questions inside a seller account is not “how many products do we have?” It is “which SKUs actually need attention this week?”
That is a different problem from product research. It is an operating decision problem. Some SKUs deserve more stock or budget. Some need listing repair. Some look healthy on revenue while quietly leaking margin. Some are simply tying up too much stock.
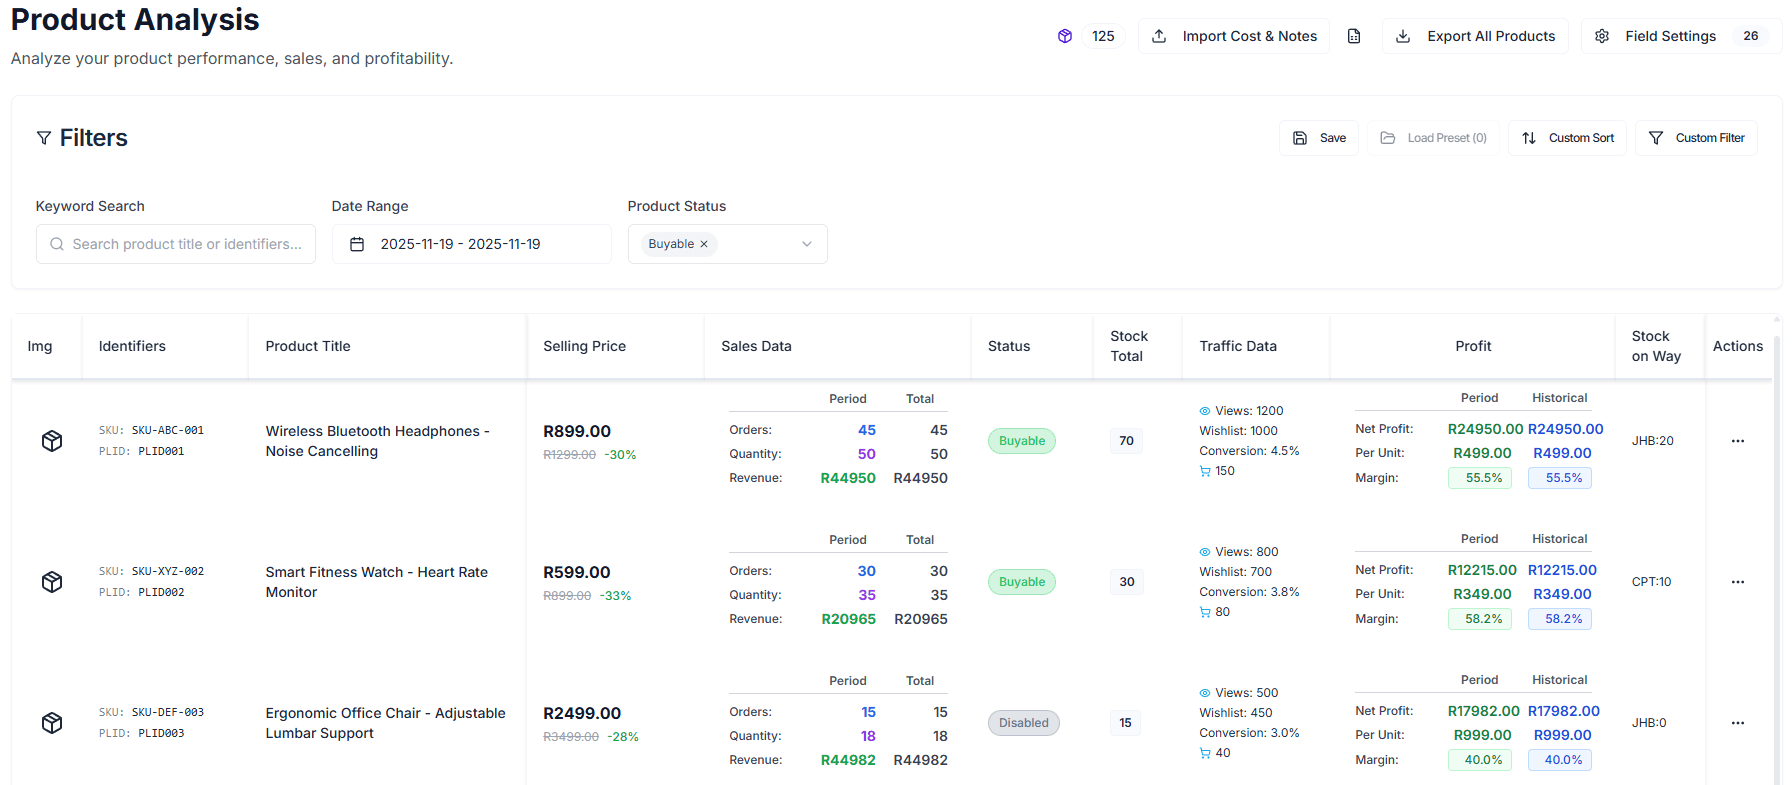
This is why Revenuealot Product Analytics matters. It helps you review sales, traffic, inventory, returns, and profit signals at SKU level, so you can decide what to push, what to repair, and what to stop over-supporting.
If you want the feature walkthrough beside this article, start with the Product Analytics docs. If you want to review your catalog now, go straight to Product Analytics.
Quick answer: which SKUs should you review first in Product Analytics?
Start with SKUs that show one strong signal and one weak signal at the same time.
Typical examples include:
- strong traffic but weak conversion
- healthy revenue but poor margin
- high stock cover with weak recent movement
- stable visibility with rising returns or refund pressure
Start a weekly SKU review by sorting products into three buckets
Most product reviews become clearer when you stop thinking in one giant list and start thinking in buckets:
| SKU bucket | What it usually looks like | Typical next move |
|---|---|---|
| Winners worth backing | Healthy demand, acceptable margin, manageable stock, stable returns | Give them more budget, stock support, or closer attention |
| Repair candidates | Traffic exists, but conversion, pricing, or listing quality is weak | Fix the offer before pushing more traffic |
| Stock and margin risks | Revenue looks decent, but stock cover, returns, or margin quality are worsening | Tighten stock, pricing, or promotional decisions |
That simple split is often the fastest way to make Takealot SKU review more useful.
When traffic is healthy but orders lag, treat it as a repair queue
Not every weak seller needs more exposure.
Sometimes the real issue is later in the funnel:
- the product gets visits, but conversion stays soft
- add-to-cart behavior is present, but buyers still do not commit
- the price sits awkwardly against the rest of the category
- the title, images, or offer framing are not convincing enough
This is where Product Analytics becomes practical. It helps you isolate products with traffic but weak conversion, which is often a cleaner starting point than simply pushing more ad spend.
Revenue can hide margin leaks
A high-revenue SKU can still be commercially weak.
That usually happens when:
- margin keeps shrinking
- return behavior gets worse
- the product needs too much stock to maintain output
- the result depends too heavily on discounting or inefficient ads
This is why cost entry, gross profit, and margin are not optional niceties in a serious SKU review. They are what separates “this product is selling” from “this product is worth supporting.”
Slow movers should be split into weak-demand products and fixable products
Not every slow-moving SKU belongs in the same pile.
You usually need to separate:
- products with weak demand and weak signals overall
- products that still get attention, but are clearly stuck on pricing, listing quality, or conversion
That distinction matters because the first group often calls for stock caution, while the second may justify listing changes, pricing work, or a better merchandising angle.
Build one recurring review view instead of starting from scratch every week
Weekly review gets easier when the workflow is reusable.
Product Analytics supports:
- configurable columns for sales, traffic, stock, and profit views
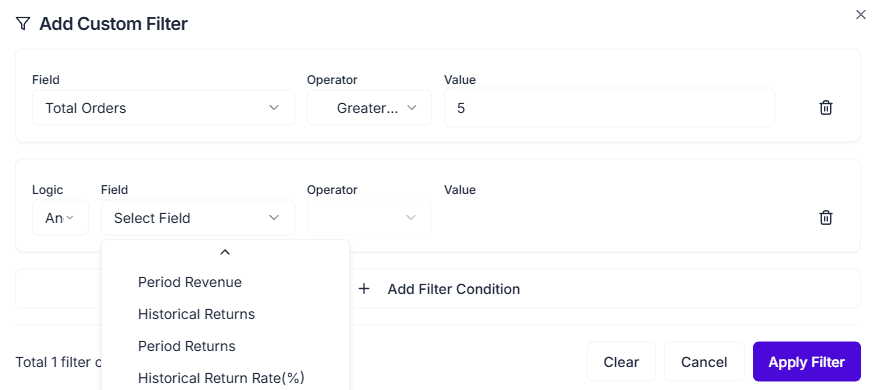
- reusable filter presets for recurring SKU groups
- exportable views for offline review
- notes and cost updates directly in the list
- product detail access when you need a deeper look
That means you can build repeatable review views such as:
- conversion repair shortlist
- margin watchlist
- slow-mover check
- return-risk review
- stock-pressure review
A simple weekly review flow inside Product Analytics
1. Start with a recent date range
That keeps the analysis tied to current behavior instead of lifetime noise.
2. Pull products with one strong signal and one weak signal
This is usually where the best decisions hide: strong traffic with weak conversion, good revenue with weak margin, or high stock cover with weak recent movement.
3. Check whether your winners are also profitable enough
If a top seller is not commercially attractive, it may deserve more control rather than more support.
4. Review returns before scaling harder
A product that sells and disappoints buyers at the same time often becomes more expensive as volume grows.
5. Leave notes close to the SKU
This matters when pricing, listing work, ads, and stock planning involve more than one person.
Where Product Analytics hands off to other tools
Product Analytics is often the middle of the workflow, not the end of it.
- If the issue looks like poor search visibility, continue with Keyword Research or Keyword Reverse.
- If the issue is broader than one SKU and affects the whole account, check Store Metrics.
- If you need fresh product directions instead of SKU triage, start with Black Box.
FAQ
What is the difference between Product Analytics and Store Metrics?
Store Metrics helps you understand overall account health. Product Analytics helps you decide which individual SKUs are driving, distorting, or dragging that result.
Which SKUs should I review first?
Start with products that combine one strong signal and one weak signal. Those are usually the fastest to diagnose and the easiest to act on.
When should I enter cost in Product Analytics?
As early as possible. Without cost, it is much harder to tell whether revenue quality is strong or simply looks busy.
Final takeaway
A good Takealot SKU review is not about scanning one headline number. It is about sorting products into winners, repair candidates, and risk cases before the week gets more expensive.
Revenuealot Product Analytics helps you do that with evidence instead of instinct. It gives you a clearer way to decide which SKUs deserve more budget, which ones need repair, and which ones should stop absorbing stock and attention.
If you want a cleaner weekly review process, open Product Analytics and build a shortlist around conversion, margin, stock cover, and returns. Keep the Product Analytics docs nearby if you want the detailed feature walkthrough while you work.