Amazon Ads Dashboard
Amazon Ad Center brings Sponsored Products performance into one workspace. You can review KPIs, compare current vs previous periods, analyze placement and campaign-type mix, and inspect campaign rows without leaving the Amazon module.
Prerequisites
- Amazon store connected
- Amazon Ads account authorized and profile sync completed
- BUSINESS or ENTERPRISE plan
- Correct store selected in the Amazon sidebar
Campaign creation and editing are still rolling out in stages. Dashboard and campaign analysis are available now, while mutation actions may remain disabled in your workspace.
What Is Included
The current Amazon Ads module focuses on two operational views:
- Dashboard: KPI summary, trend chart, campaign type summary, placement summary, and top campaigns
- Campaigns: Filterable campaign table with state, targeting mode, budget, and current/previous performance metrics
The top navigation already mirrors the broader Ads module structure, so training materials remain aligned as more tabs are enabled.
Dashboard View
The dashboard is built for fast daily review:
- Metric cards show cost, sales, ACOS, TCOS, impressions, clicks, CTR, CVR, CPC, CPA, orders, and units
- Previous-period comparison is displayed directly on each metric card
- Trend chart supports day, week, and month aggregation
- Campaign Type helps compare SP / SB / SD contribution
- Placement highlights how Top of search, Product pages, and Rest of search are performing
- Top Campaigns ranks campaigns by cost, sales, orders, ACOS, or ROAS
Date Range
- Default range is a recent rolling window
- Preset and custom date ranges are supported
- Comparison values are calculated against the immediately preceding period of equal length
Campaigns View
The campaigns page is designed for campaign-level inspection and prioritization.
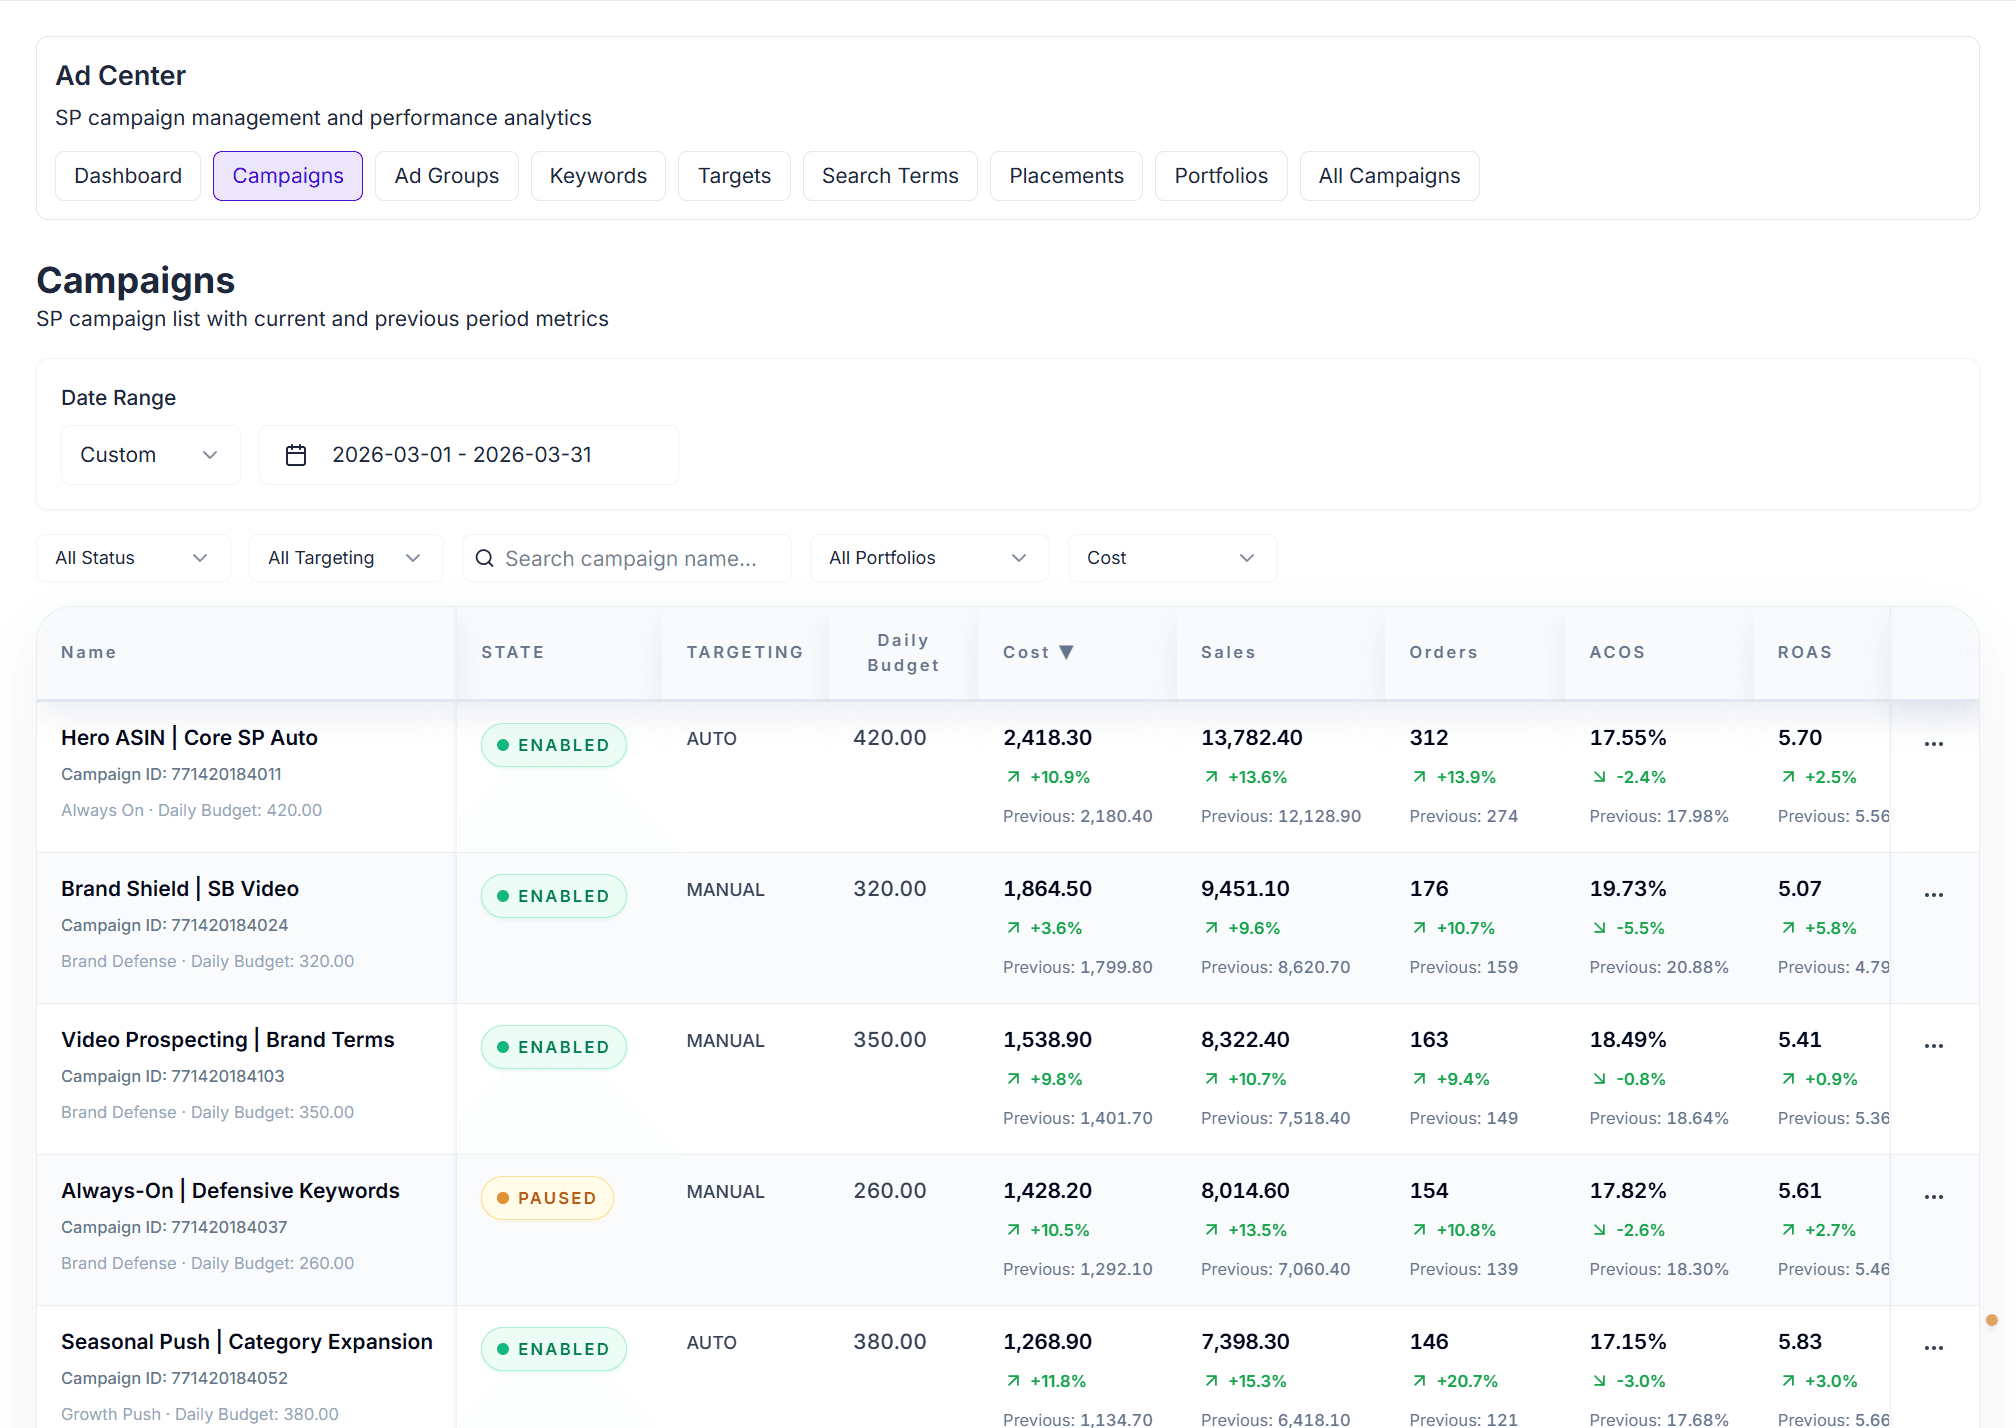
Core Controls
- Status filter: enabled, paused, archived
- Targeting filter: auto or manual
- Search box: search by campaign name or campaign ID
- Portfolio filter: narrow the table to one portfolio
- Sort selector and sortable headers: reorder by cost, sales, orders, ACOS, ROAS, impressions, clicks, CTR, budget, or name
- Pagination: 20 / 50 / 100 rows per page
Table Columns
Each row surfaces the core decision inputs for campaign review:
- Campaign name and campaign ID
- State
- Targeting type
- Daily budget
- Cost
- Sales
- Orders
- ACOS
- ROAS
- Impressions
- Clicks
- CTR
Every major performance column shows:
- current-period value
- percentage change
- previous-period value
This makes it easy to detect campaigns that are spending more, declining in efficiency, or scaling successfully.
Recommended Review Workflow
- Start on the dashboard to confirm whether spend and sales moved in the expected direction.
- Check placement and campaign-type summaries to identify where performance shifted.
- Move to the campaigns tab to filter down to the segment causing the change.
- Sort by cost, sales, ACOS, or ROAS to isolate winners and underperformers.
Data Freshness
- Amazon Ads data is synced into Revenuealot on a scheduled basis
- Reporting values are typically not real-time and can lag behind Amazon’s live console
- Daily report-style metrics commonly reflect completed reporting windows rather than intraday live spend
Troubleshooting
No campaigns or empty dashboard
Confirm the Ads account was authorized successfully and that at least one profile is synced for the selected store.
Wrong store or profile context
Switch the store in the Amazon sidebar before reviewing Ads data.
Metrics look delayed
Check the sync cadence and wait for the next scheduled update window.
Next Steps
- 📘 Amazon Overview - Module scope and access requirements
- 🔌 Store Connection - Connect Amazon store and Ads account
- 📈 Amazon Store Metrics - Review store-level KPIs outside Ads
- 📦 Amazon Product Analytics - Compare advertising results with product performance