Makro Product Analytics
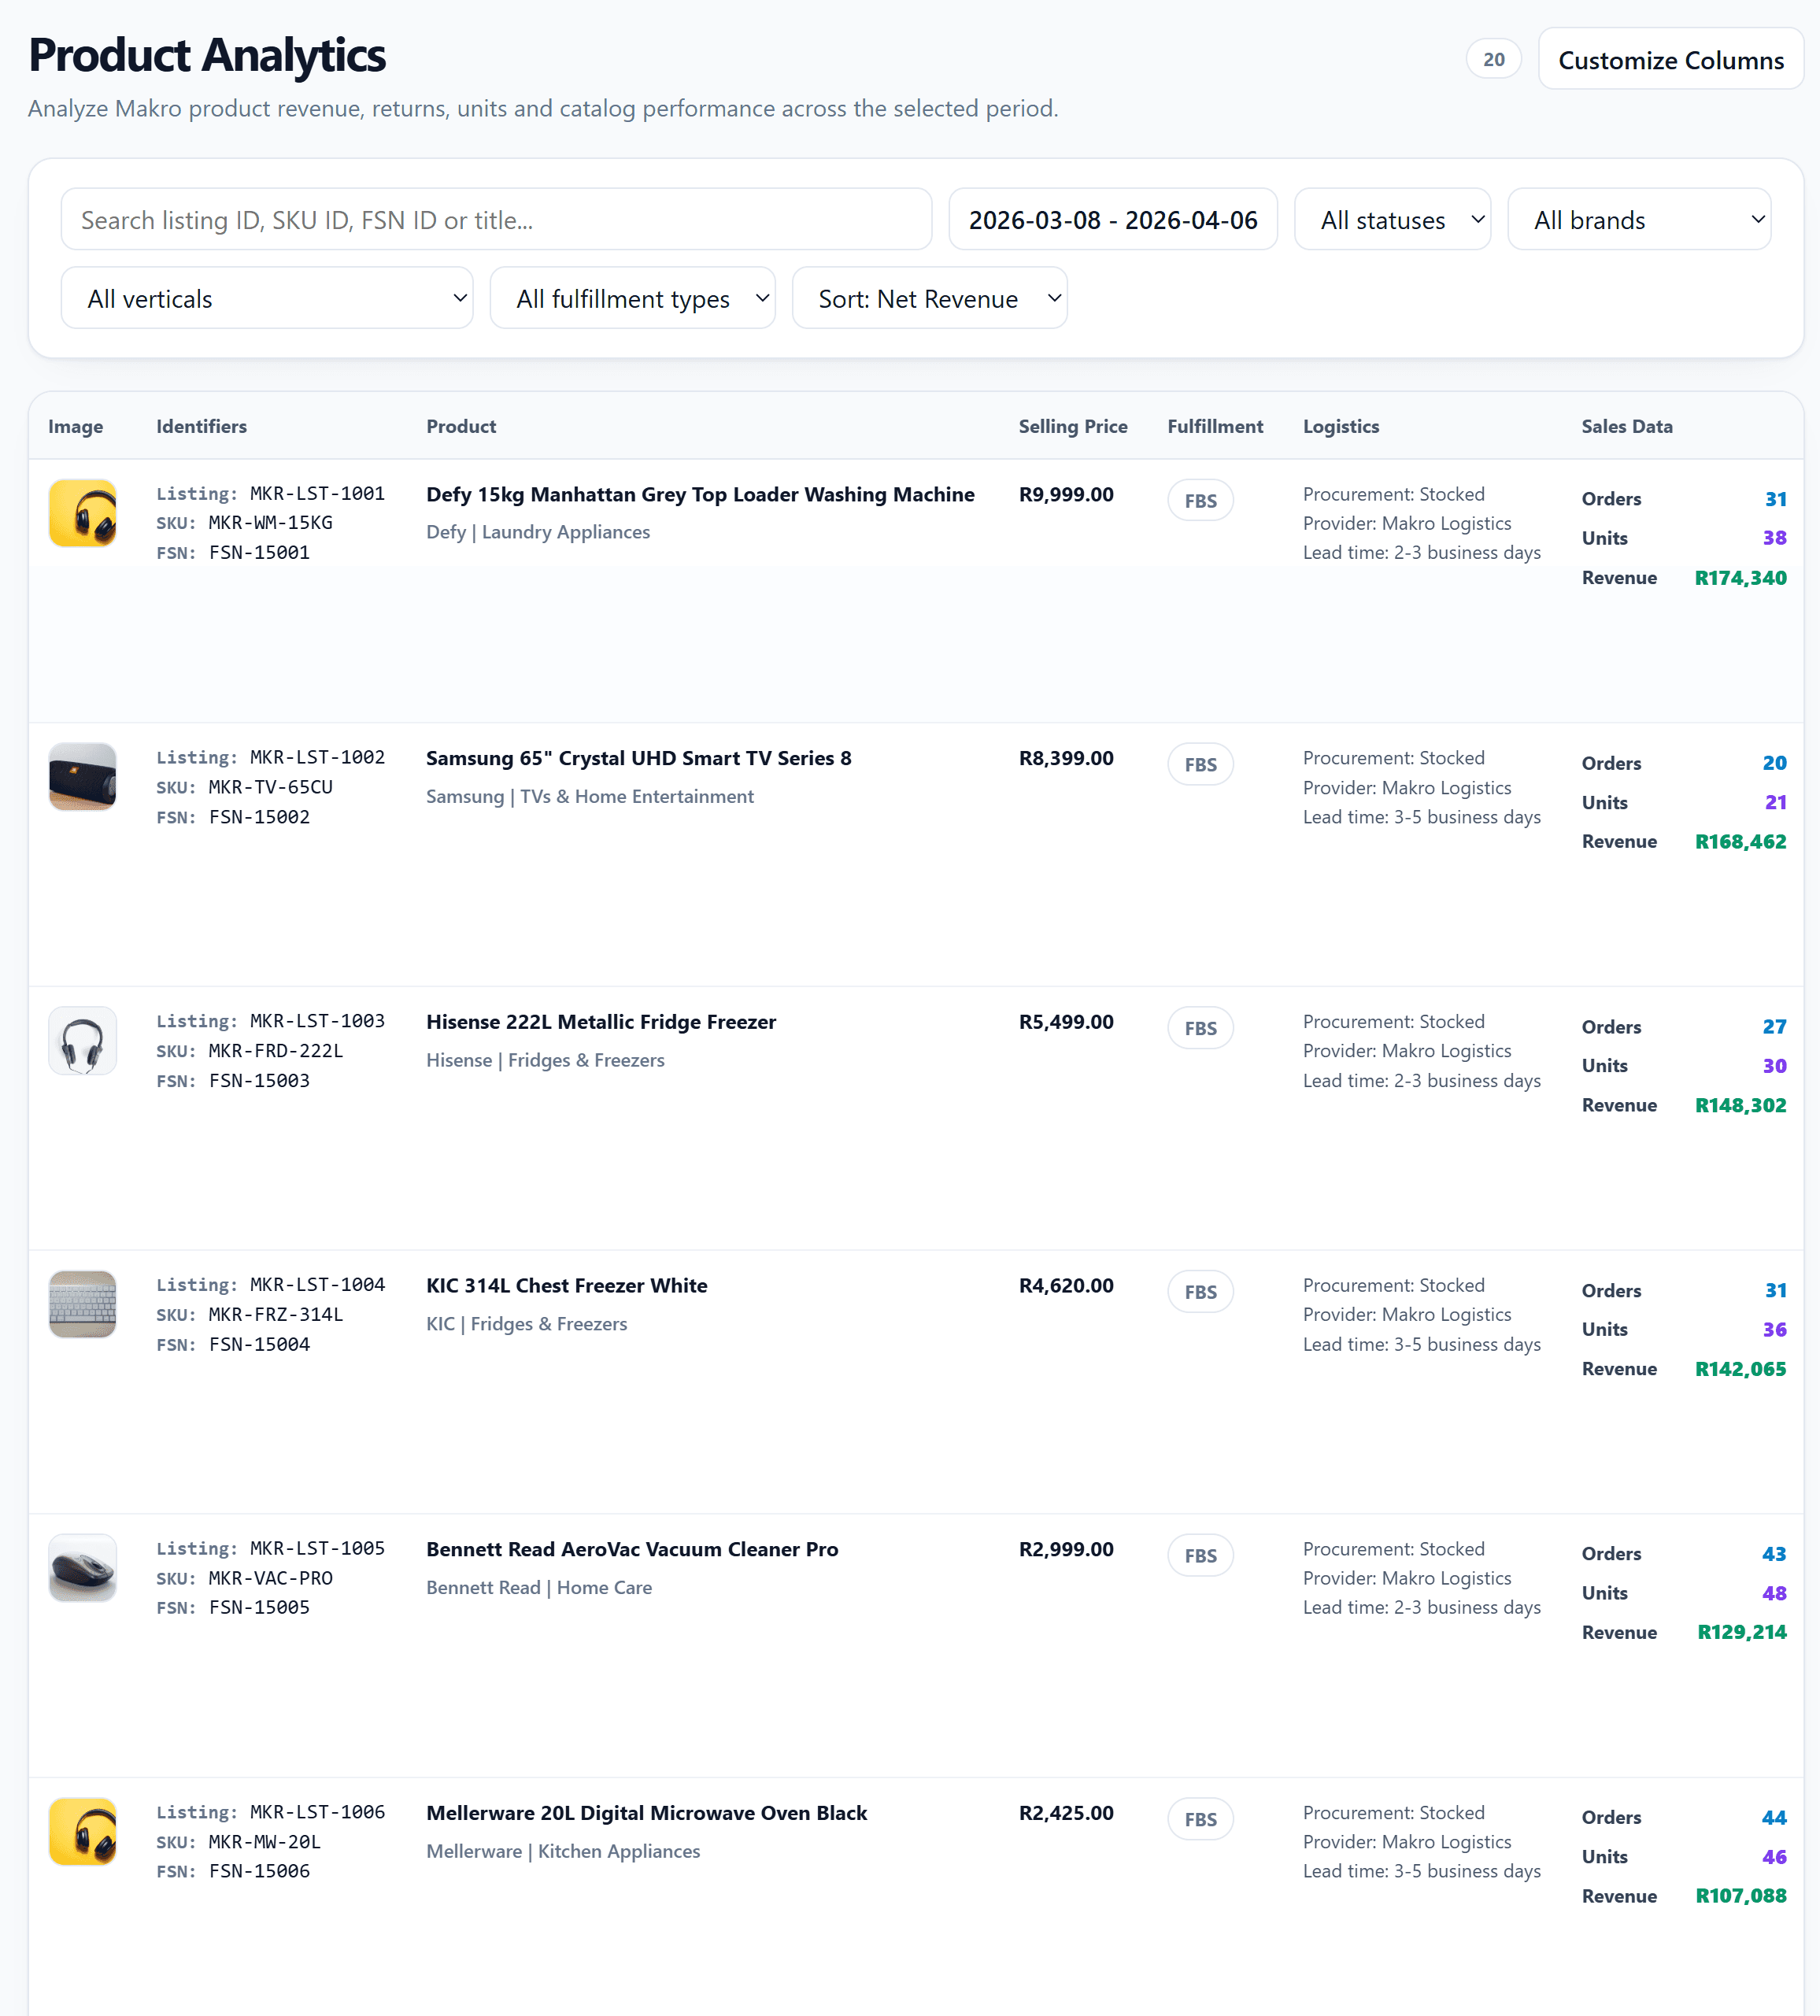
Makro Product Analytics is the SKU-level workspace for your Makro catalog. It helps you review sales performance, returns performance, fulfillment data, and basic listing information for each product within a selected date range.
The page remembers filters, sorting, visible columns, and page size per store, so repeated analysis is faster.
What You Can See in the List
This page is not just a product table. It is a configurable analytics view for your catalog.
Basic information
-
Product image
-
Product title
-
Listing ID -
SKU ID -
FSN ID -
Product status
-
Created date
Selling and fulfillment data
-
Selling Price: Current Makro price
-
Fulfillment: Displayed as
FBSorFBM -
Optional logistics fields
- Procurement
- Shipping Provider
- Lead Time
Sales block
The sales column compares:
-
Current selected period orders, units, and revenue
-
Historical total orders, units, and revenue
Returns block
The returns column compares:
-
Current selected period return count and refund amount
-
Historical total return count and refund amount
Quick actions
-
Click the product title to open the product detail page in a new tab
-
Click
Opento jump directly to the Makro storefront page
Filters, Presets, and Sorting
The page supports both common filters and more structured custom filtering.
Common filters
-
Keyword Search: Search by
Listing ID,SKU ID,FSN ID, or title -
Date Range: Defaults to the last 30 days
-
Status: Focus on a specific product status
-
Fulfillment: Separate
FBSandFBMlistings
Advanced filter fields
Custom filtering also supports:
-
Brand
-
Vertical
-
Fulfillment
-
Status
Sort fields
You can sort by:
-
Net Revenue
-
Net Orders
-
Net Units
-
Return Orders
-
Return Amount
-
Return Rate
-
Selling Price
-
Created Date
-
Title
-
Brand
-
Vertical
-
Fulfillment
-
Status
Presets
If you frequently review the same slice of catalog data, save a preset. This is useful for views like “FBS only”, “high-return SKUs”, or “a specific vertical sorted by revenue”.
Column Settings and Table View
The column selector lets you show or hide these modules:
-
Image
-
Identifiers
-
Title
-
Status
-
Created date
-
Price
-
Fulfillment
-
Logistics
-
Sales data
-
Return data
-
Actions
The table supports pagination with 20 / 50 / 100 rows per page. For faster issue triage, keep only the core columns visible; for reporting, enable both sales and return blocks together.
Product Detail Page
Clicking a product title opens the detail page for deeper SKU analysis.
Overview section
-
Product title and image
-
Listing / SKU / FSN -
Selling price
-
Specification dimensions
-
Category
-
Fulfillment
-
Weight
-
Brand
Summary cards
The detail page shows:
-
Net Orders
-
Net Units
-
Net Revenue
-
Return Orders
-
Return Quantity
-
Return Rate
-
Refund Amount
Trend chart
The product trend chart supports:
-
Revenue
-
Selling Price
-
Orders
-
Units
You can toggle each line from the legend to focus on the metric you care about.
Returns detail table
The bottom table includes return records for the selected product and date range, including:
-
Return ID -
Reason
-
Sub-reason / comments
-
Quantity
-
Amount
-
Status
-
Tracking
-
QC status
-
Requested date
-
Completed date
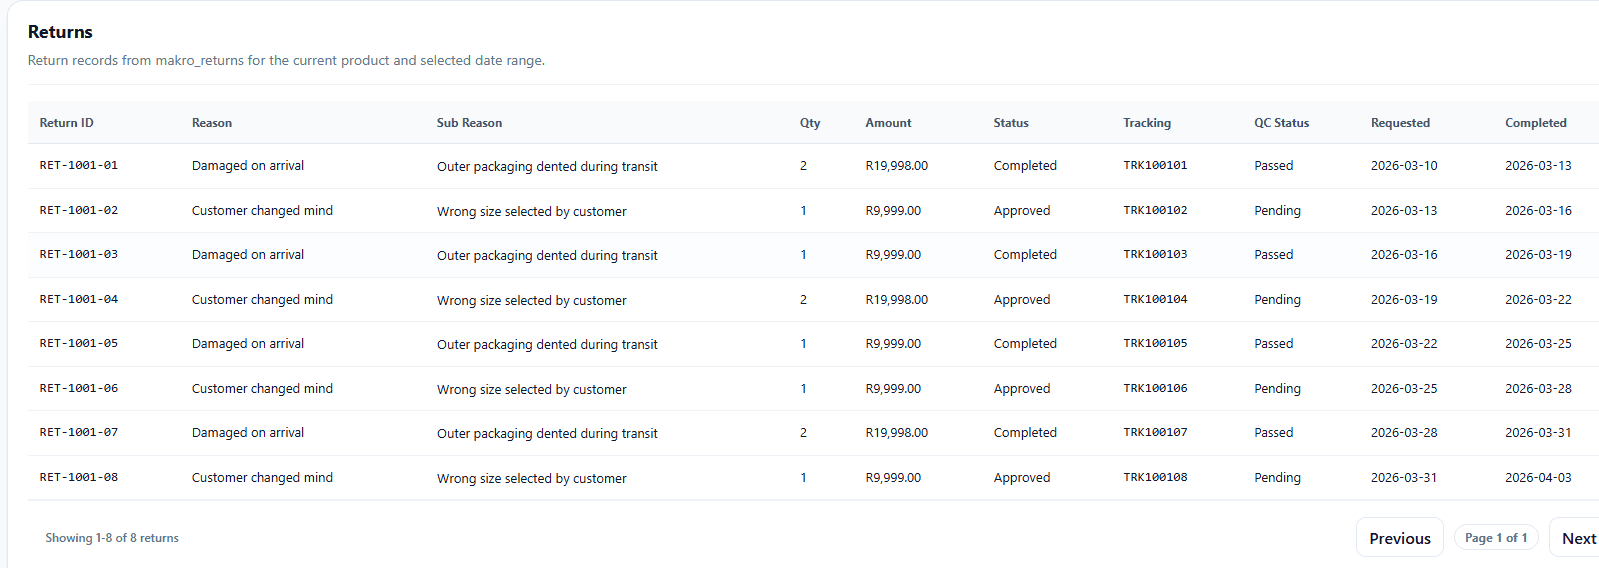
When a SKU has an unusually high return rate, the detail page is usually the fastest place to understand why.
Typical Use Cases
Find high-return SKUs
Sort by Return Amount or Return Rate, then open the detail page to inspect the actual return records.
Review new listings
Sort by Created Date to quickly see whether recently added products are already generating orders and revenue.
Compare fulfillment groups
Filter by Fulfillment to evaluate FBS and FBM products separately.
Recommended workflow Use the list page to filter and rank products at scale, then use the detail page to investigate trends and returns for the few SKUs that matter.